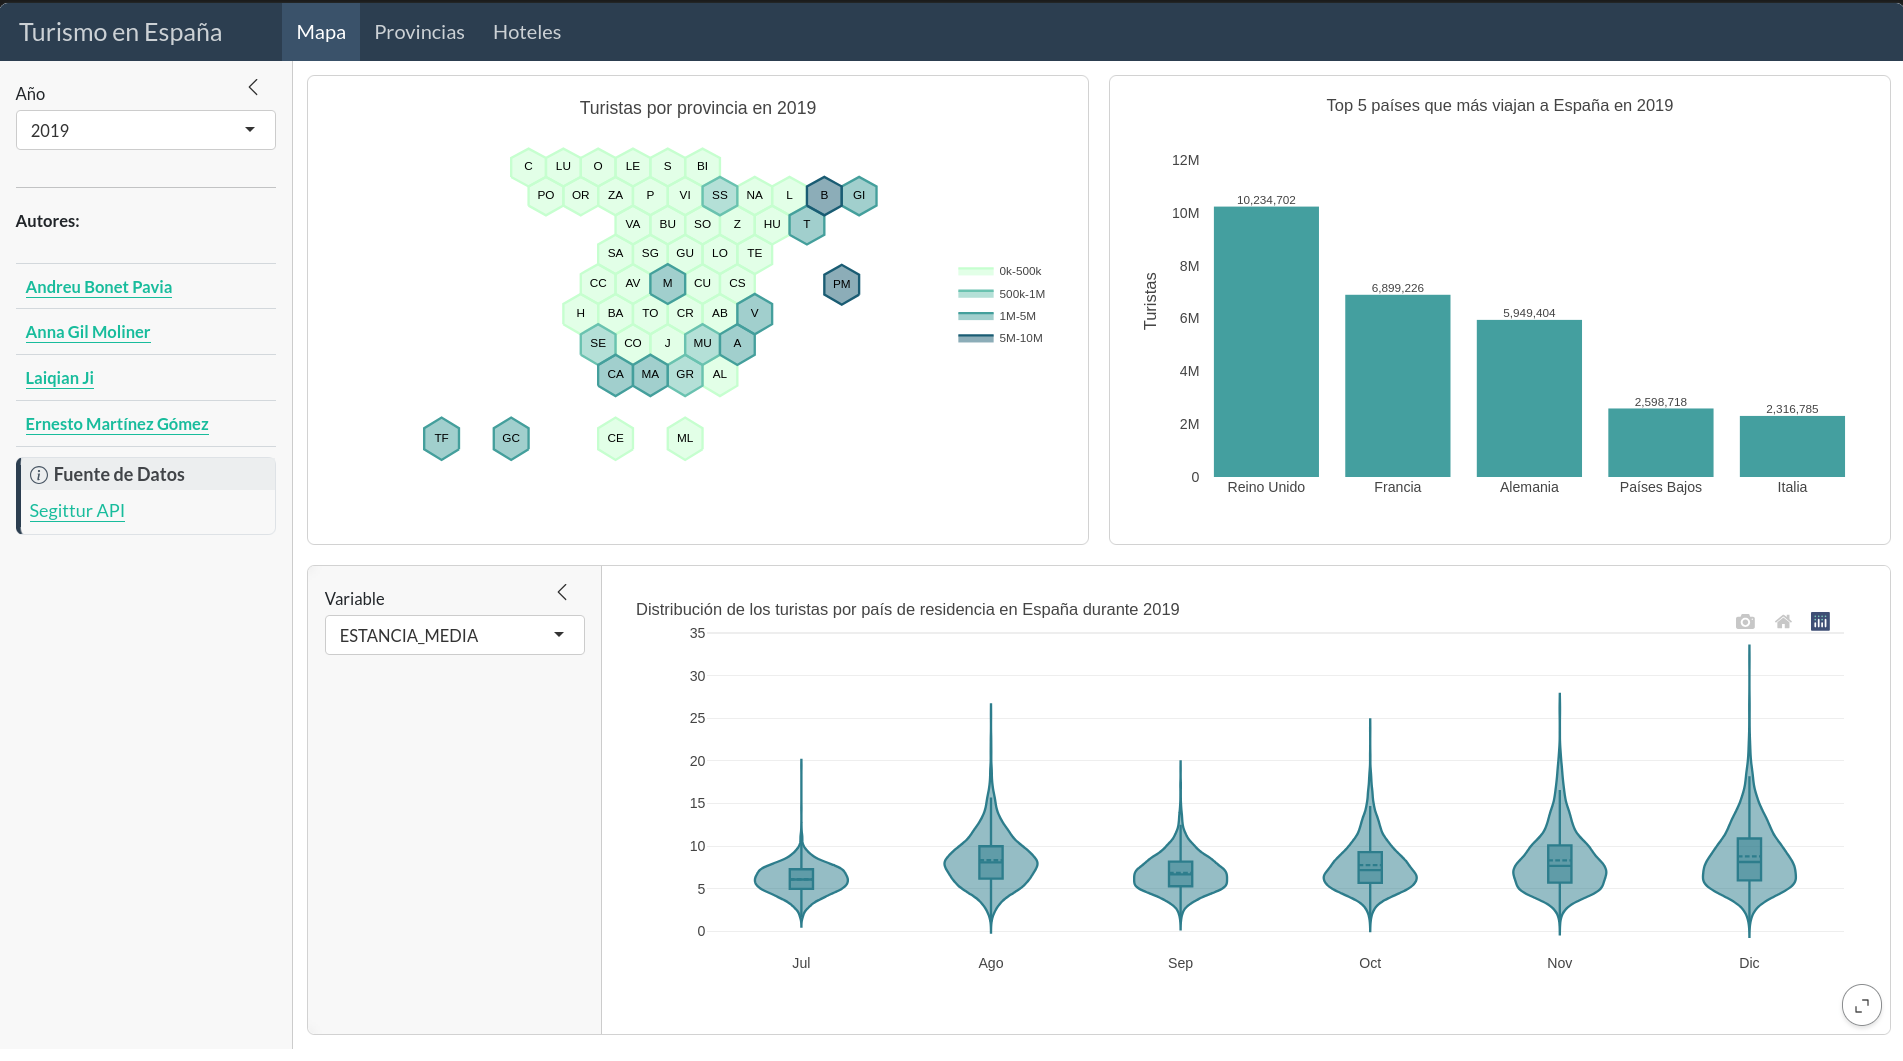
Tourism interactive dashboard
Data visualization
Interactive dashboard exploring tourism metrics with rich charts and filters.
- r
- plotly
- shiny

Hi there, I'm Ernesto.
I build data-driven products using ML, optimization, and software engineering
- always aiming for reproducibility, scalability, and business value.
Selected work across data, ML, and apps — practical builds that ship.

Data visualization
Interactive dashboard exploring tourism metrics with rich charts and filters.

Urban mobility analytics
Exploratory data analysis and visualization of Valencia’s transport network.

NLP classification
Model that classifies company descriptions into industry/NAICS categories.
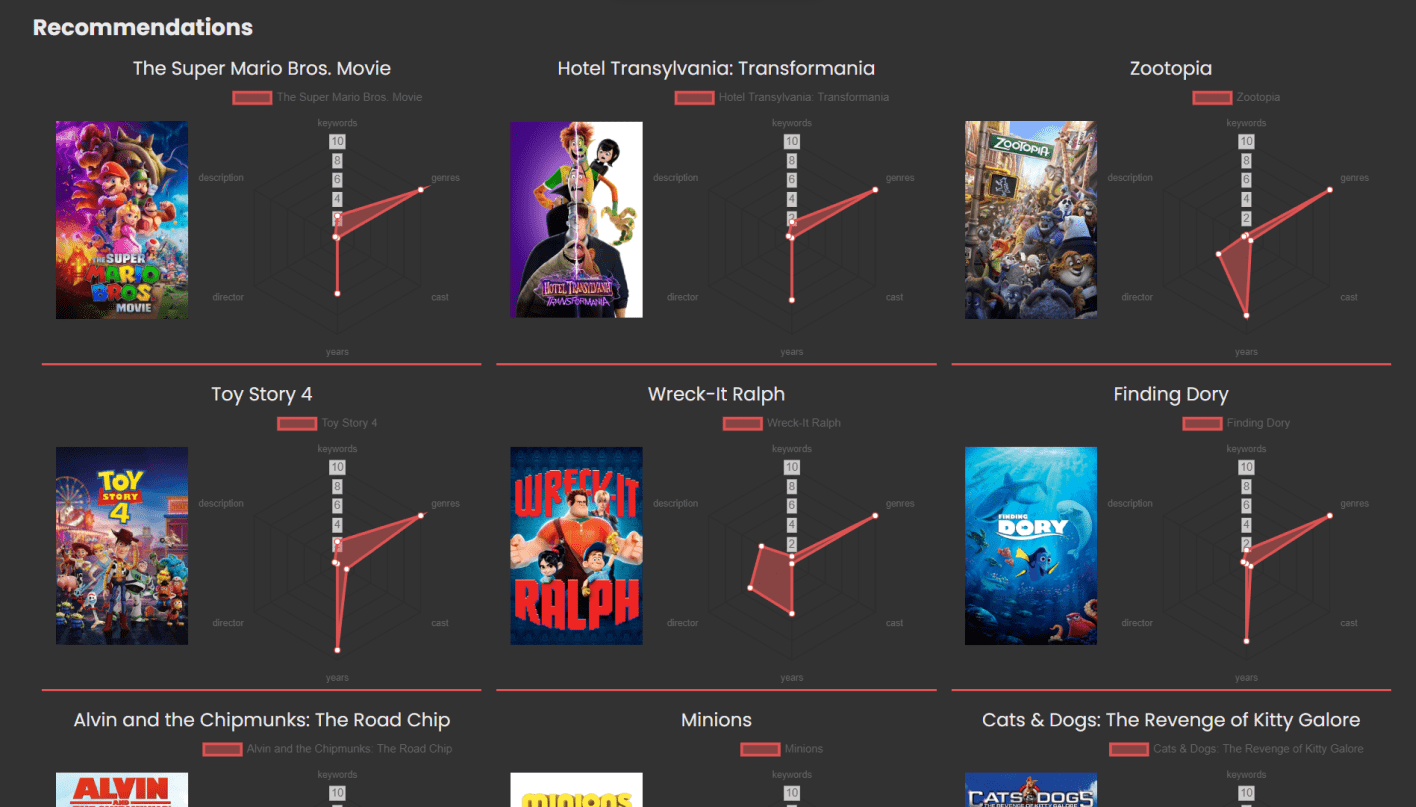
Recommender system
Web app that recommends movies based on user preferences and ratings.
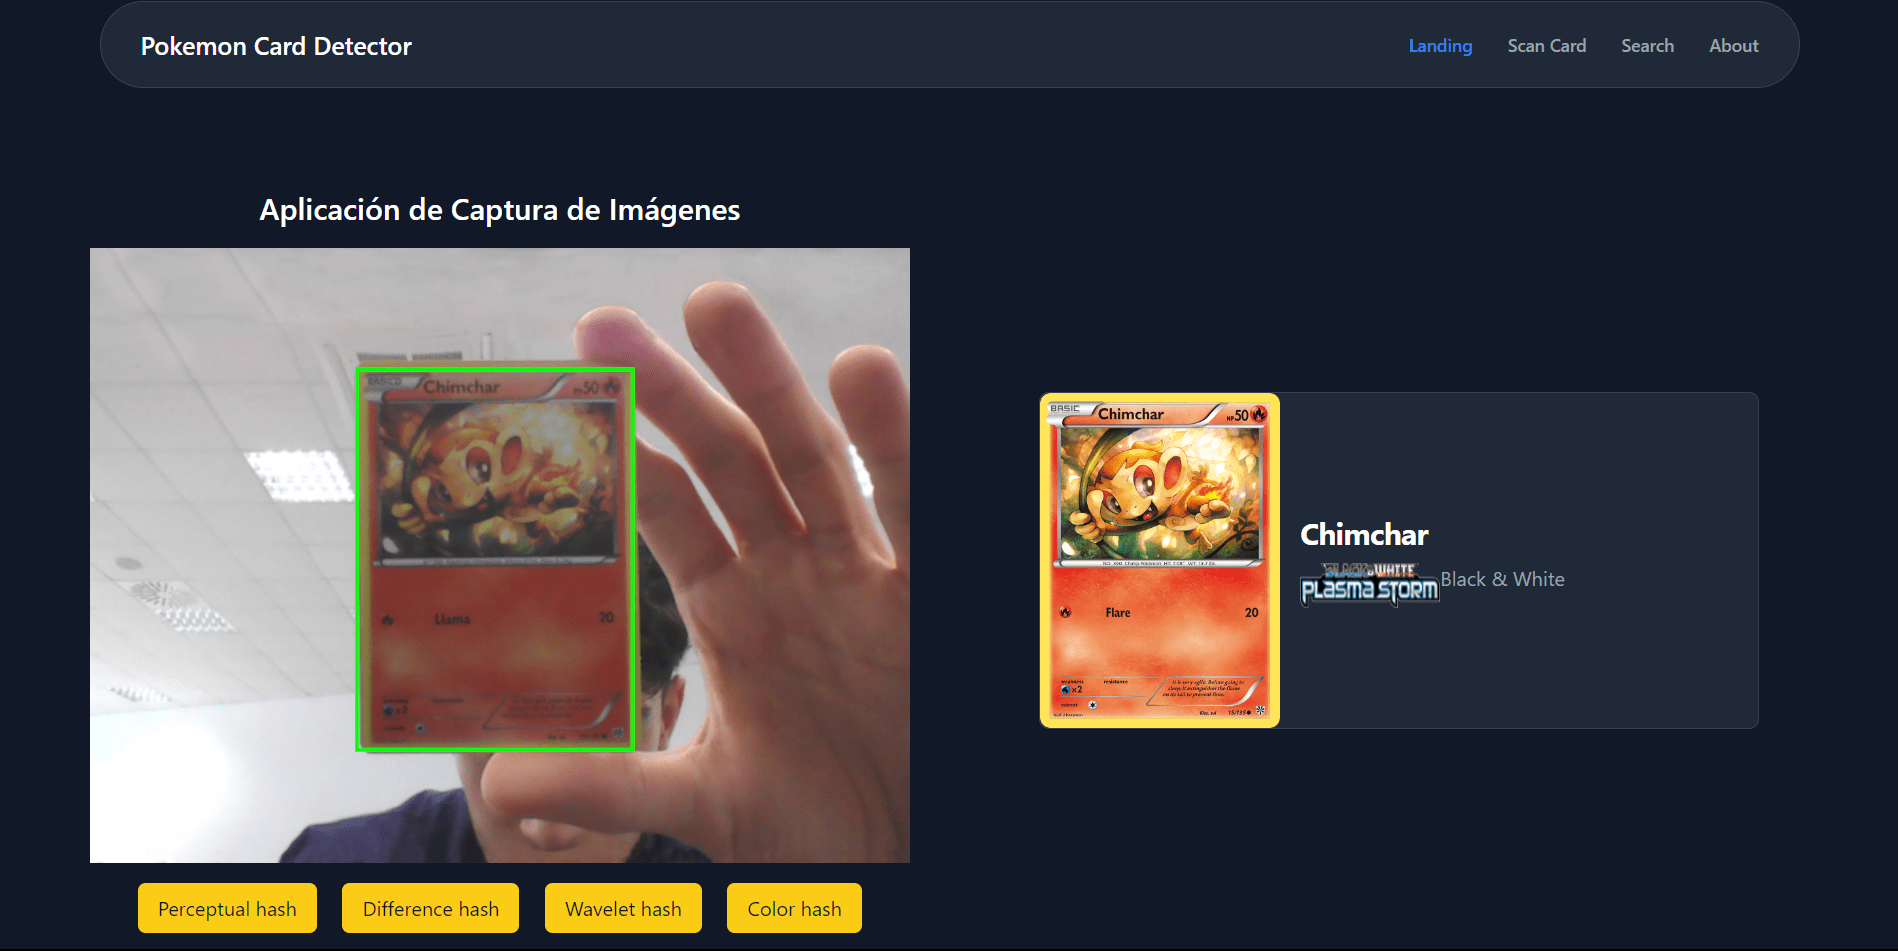
Computer vision
Real‑time detection of Pokémon TCG cards using a custom vision pipeline.
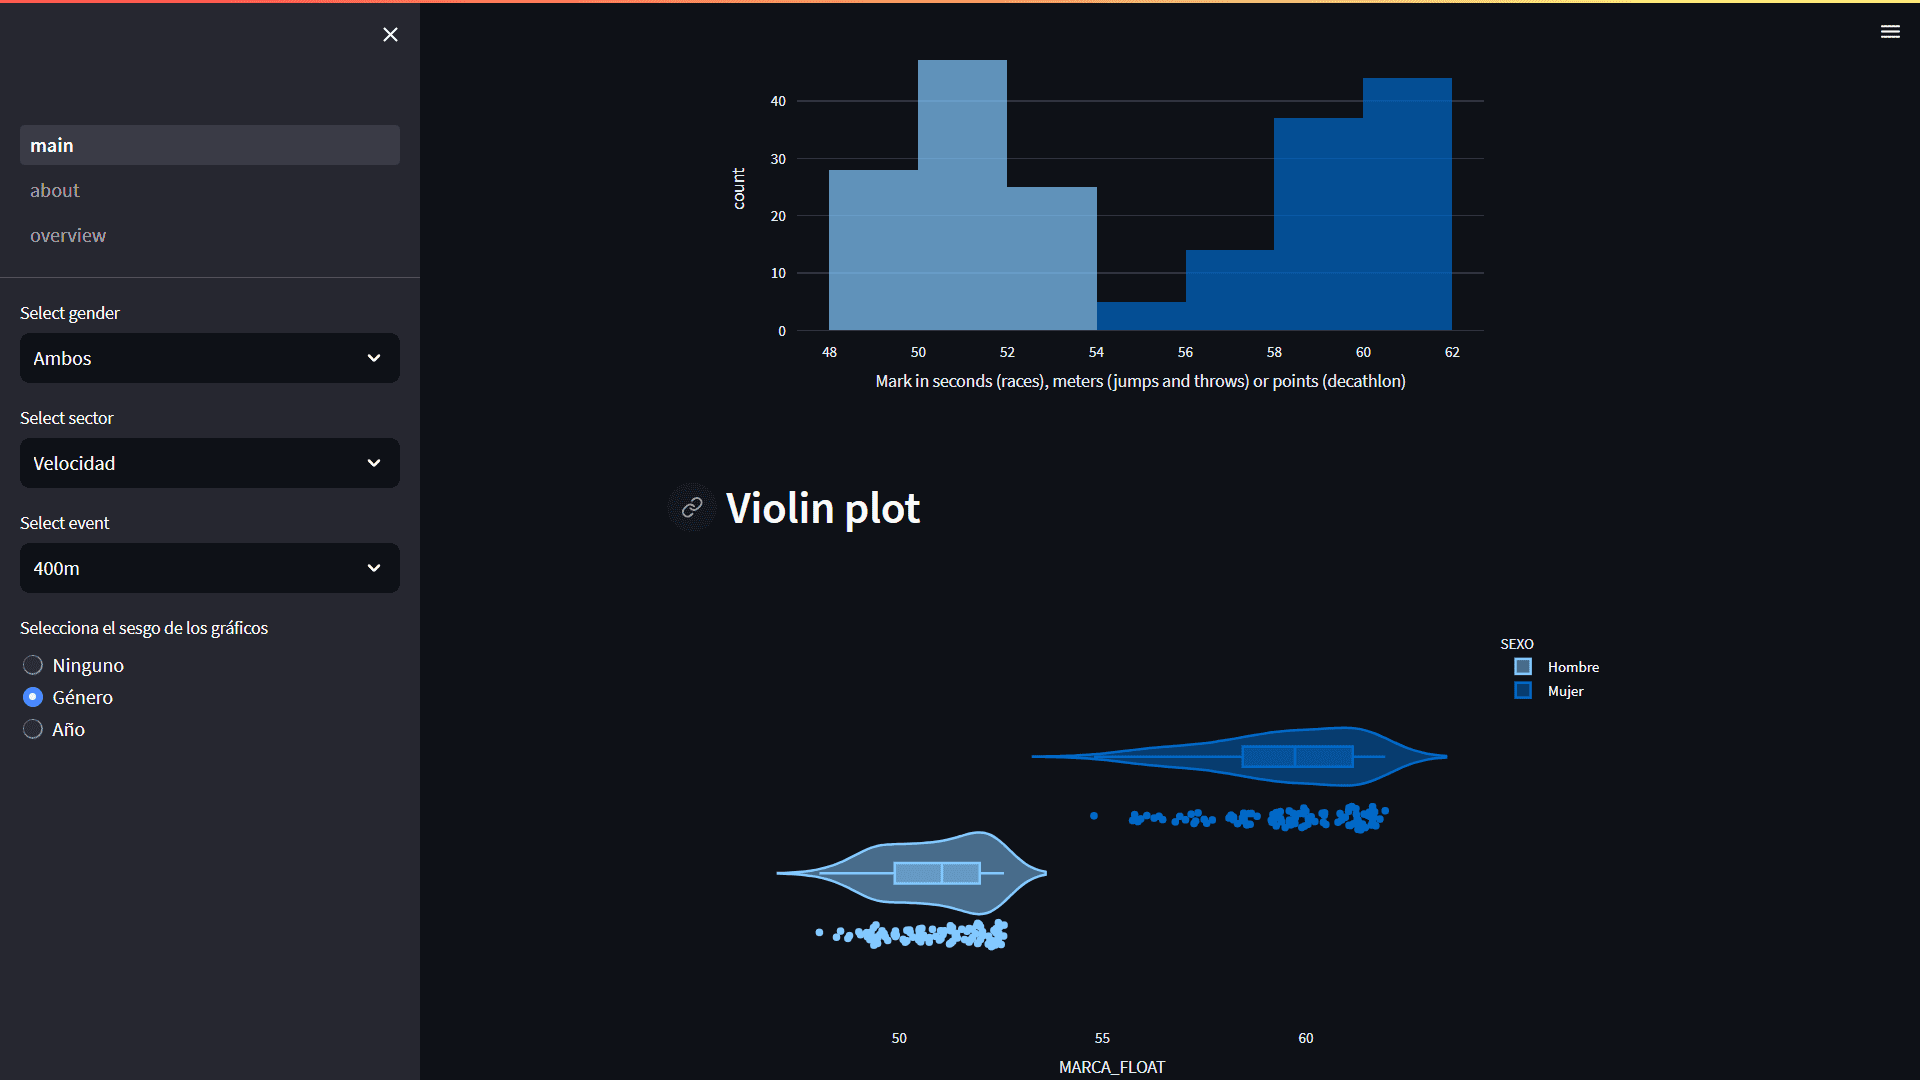
Sports analytics
Analysis and ranking of U‑18 athletics performances with visual insights.
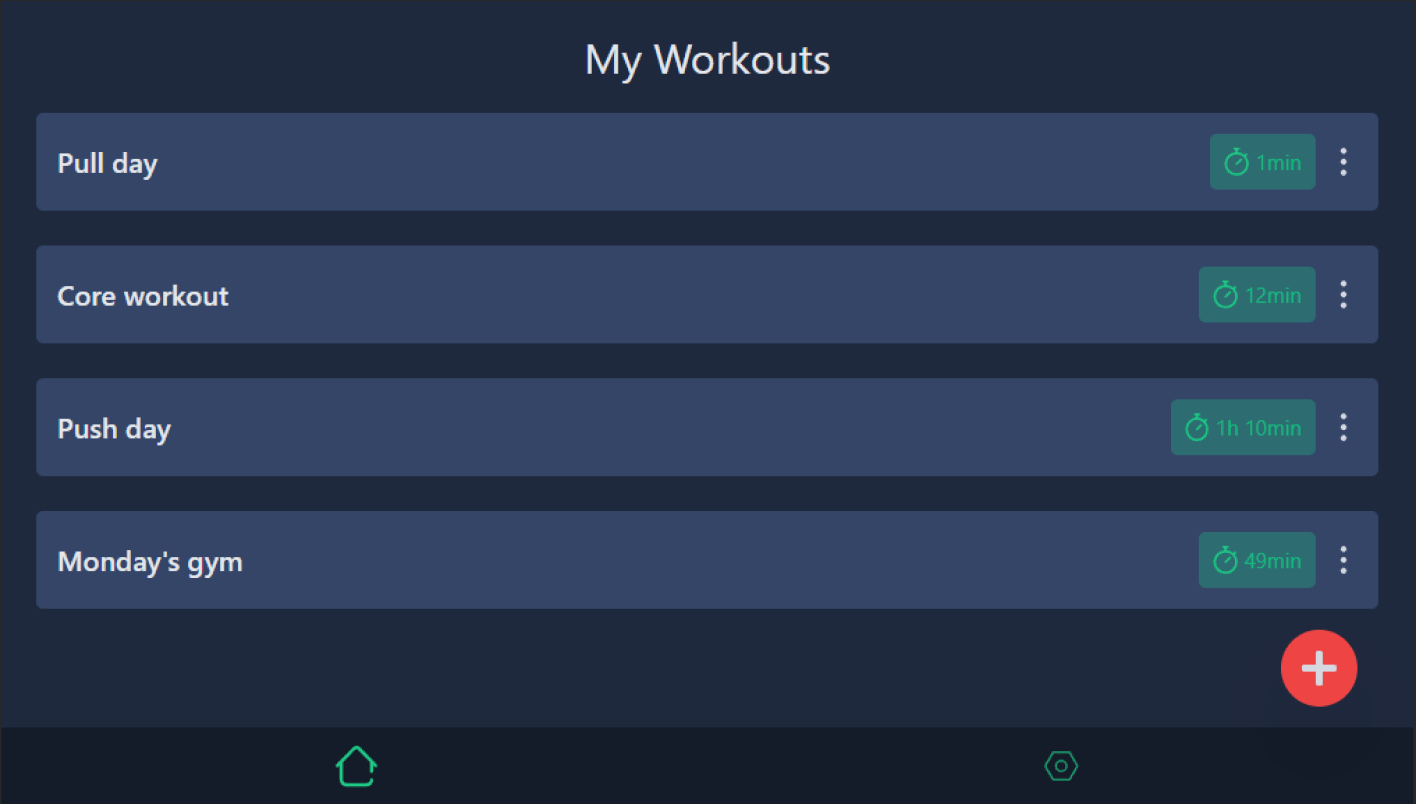
Full‑stack app
Interval and workout timer application designed for simple daily routines.
Started programming in Python as a self-taught developer.
Enrolled in BSc Data Science at Polytechnic University of Valencia
Co-founded Sigma Data Club at UPV. Led development and analytics, growing a hands-on AI community.
Joined Eaship, a logistics startup, as a Data Scientist intern. Solved real-world routing and optimization problems.
